Tailscale 是什么
Tailscale 是一种基于 WireGuard 的虚拟组网工具.
与 OpenVPN 之流相比还是能甩好几十条街的,Tailscale 虽然在性能上做了些许取舍,但在功能和易用性上绝对是完爆其他工具:
- 开箱即用
- 无需配置防火墙
- 没有额外的配置
- 高安全性/私密性
- 自动密钥轮换
- 点对点连接
- 支持用户审查端到端的访问记录
- 在原有的 ICE、STUN 等 UDP 协议外,实现了 DERP TCP 协议来实现 NAT 穿透
- 基于公网的控制服务器下发 ACL 和配置,实现节点动态更新
- 通过第三方(如 Google) SSO 服务生成用户和私钥,实现身份认证
简而言之,我们可以将 Tailscale 看成是更为易用、功能更完善的 WireGuard。
Headscale 是什么
Tailscale 的控制服务器是不开源的,而且对免费用户有诸多限制,这是人家的摇钱树,可以理解。好在目前有一款开源的实现叫 Headscale,这也是唯一的一款,希望能发展壮大。
Headscale 由欧洲航天局的 Juan Font 使用 Go 语言开发,在 BSD 许可下发布,实现了 Tailscale 控制服务器的所有主要功能,可以部署在企业内部,没有任何设备数量的限制,且所有的网络流量都由自己控制
Headscale 部署
Headscale 部署很简单,推荐直接在 Linux 主机上安装
首先需要到其 GitHub 仓库的 Release 页面下载最新版的二进制文件。
|
|
创建配置目录:
|
|
创建目录用来存储数据与证书:
|
|
创建空的 SQLite 数据库文件:
|
|
创建 Headscale 配置文件:
|
|
修改配置文件,将
server_url改为公网 IP 或域名。如果是国内服务器,域名必须要备案。我的域名无法备案,所以我就直接用公网 IP 了。如果暂时用不到 DNS 功能,可以先将
magic_dns设为 false。server_url设置为http://<PUBLIC_IP>:8080,将<PUBLIC_IP>替换为公网 IP 或者域名。可自定义私有网段,也可同时开启 IPv4 和 IPv6:
123ip_prefixes:# - fd7a:115c:a1e0::/48- 10.1.0.0/16
创建 SystemD service 配置文件:
|
|
创建 headscale 用户:
|
|
修改 /var/lib/headscale 目录的 owner:
|
|
修改配置文件中的 unix_socket:
|
|
Reload SystemD 以加载新的配置文件:
|
|
启动 Headscale 服务并设置开机自启:
|
|
查看运行状态:
|
|
查看占用端口:
|
|
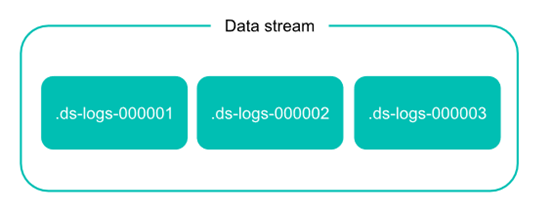
ailscale 中有一个概念叫 tailnet,你可以理解成租户,租户与租户之间是相互隔离的,具体看参考 Tailscale 的官方文档: What is a tailnet。Headscale 也有类似的实现叫 namespace,即命名空间。我们需要先创建一个 namespace,以便后续客户端接入,例如
|
|
查看命名空间:
|
|
Tailscale 客户端接入
Linux
Tailscale 官方提供了各种 Linux 发行版的软件包,但国内的网络你懂得,软件源根本用不了。好在官方还提供了 静态编译的二进制文件,我们可以直接下载。例如:
|
|
解压:
|
|
将二进制文件复制到官方软件包默认的路径下:
|
|
将 systemD service 配置文件复制到系统路径下:
|
|
将环境变量配置文件复制到系统路径下:
|
|
启动 tailscaled.service 并设置开机自启:
|
|
查看服务状态:
|
|
Tailscale 接入 Headscale:
|
|
这里推荐将 DNS 功能关闭,因为它会覆盖系统的默认 DNS。如果你对 DNS 有需求,可自己研究官方文档,这里不再赘述。
执行完上面的命令后,会出现下面的信息:
|
|
在浏览器中打开该链接,就会出现如下的界面
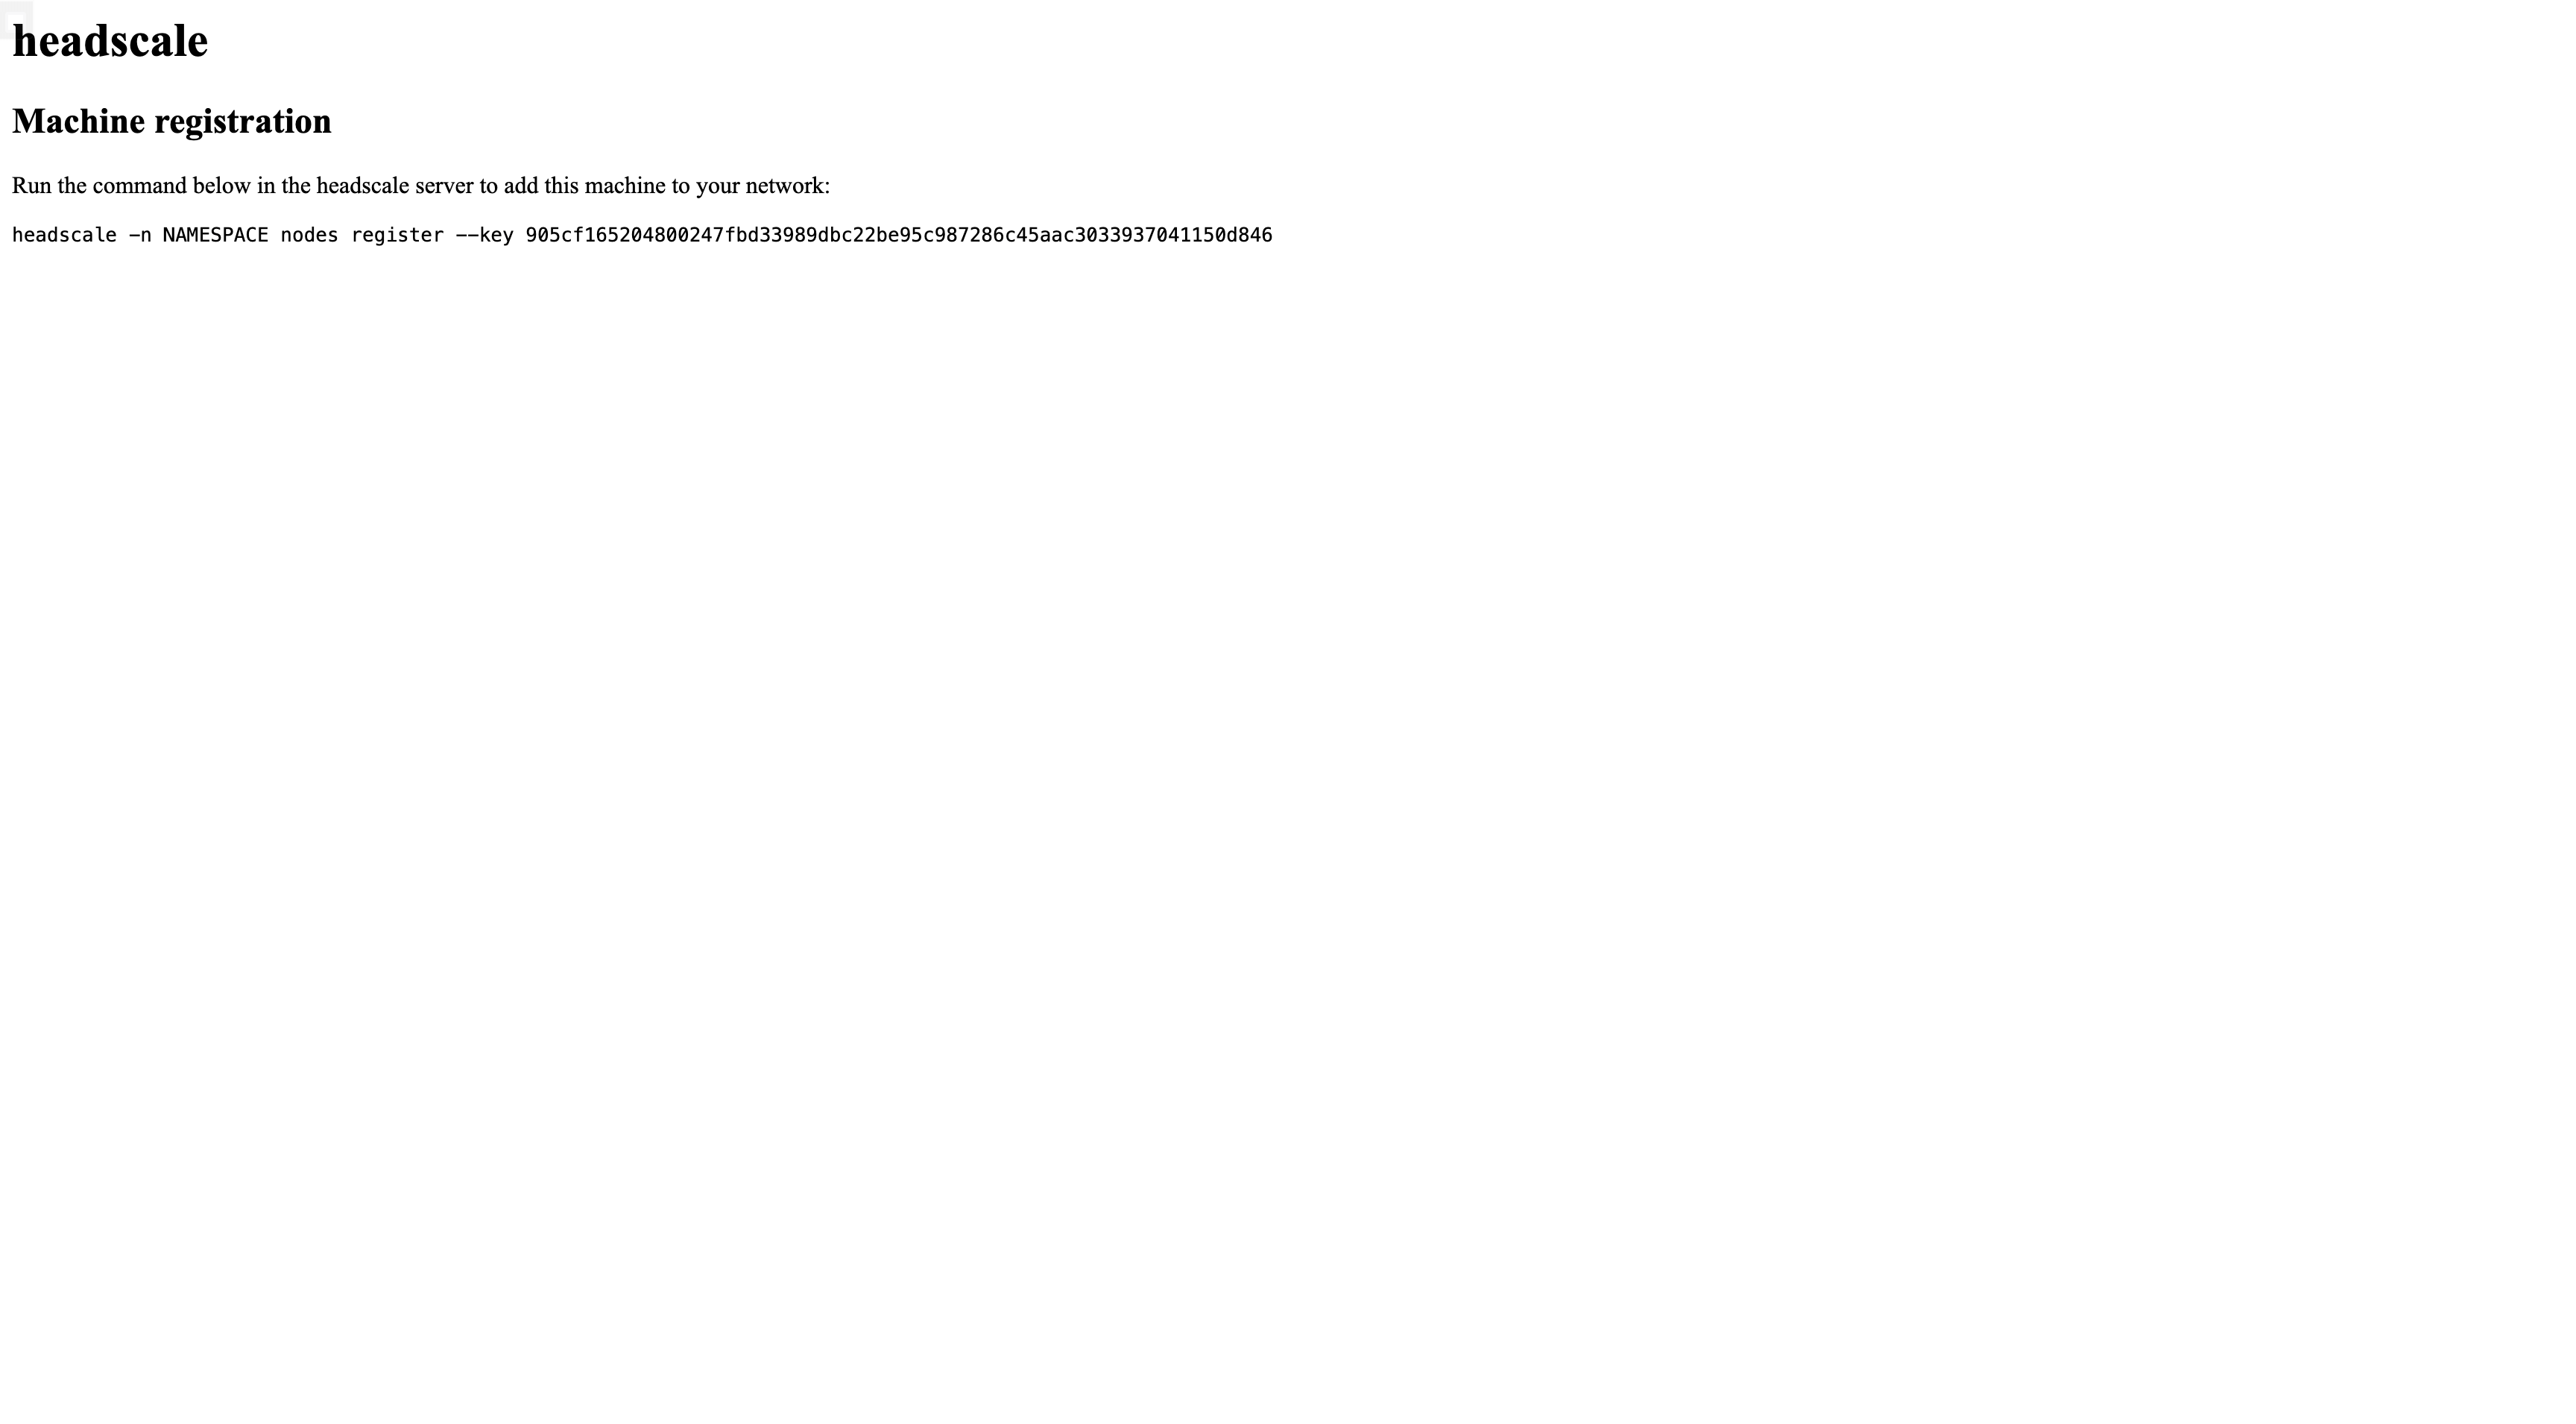
将其中的命令复制粘贴到 headscale 所在机器的终端中,并将 NAMESPACE 替换为前面所创建的 namespace。
|
|
注册成功,查看注册的节点:
|
|
回到 Tailscale 客户端所在的 Linux 主机,可以看到 Tailscale 会自动创建相关的路由表和 iptables 规则。路由表可通过以下命令查看
|
|
macOS
macOS 有 3 种安装方法:
- 直接通过应用商店安装,地址: https://apps.apple.com/ca/app/tailscale/id1475387142。前提是你**需要一个美区 ID**。。。
- 下载 安装包直接安装,绕过应用商店。
- 安装开源的命令行工具
tailscale和tailscaled。相关链接: https://github.com/tailscale/tailscale/wiki/Tailscaled-on-macOS。
这三种安装包的核心数据包处理代码是相同的,唯一的区别在于在于打包方式以及与系统的交互方式
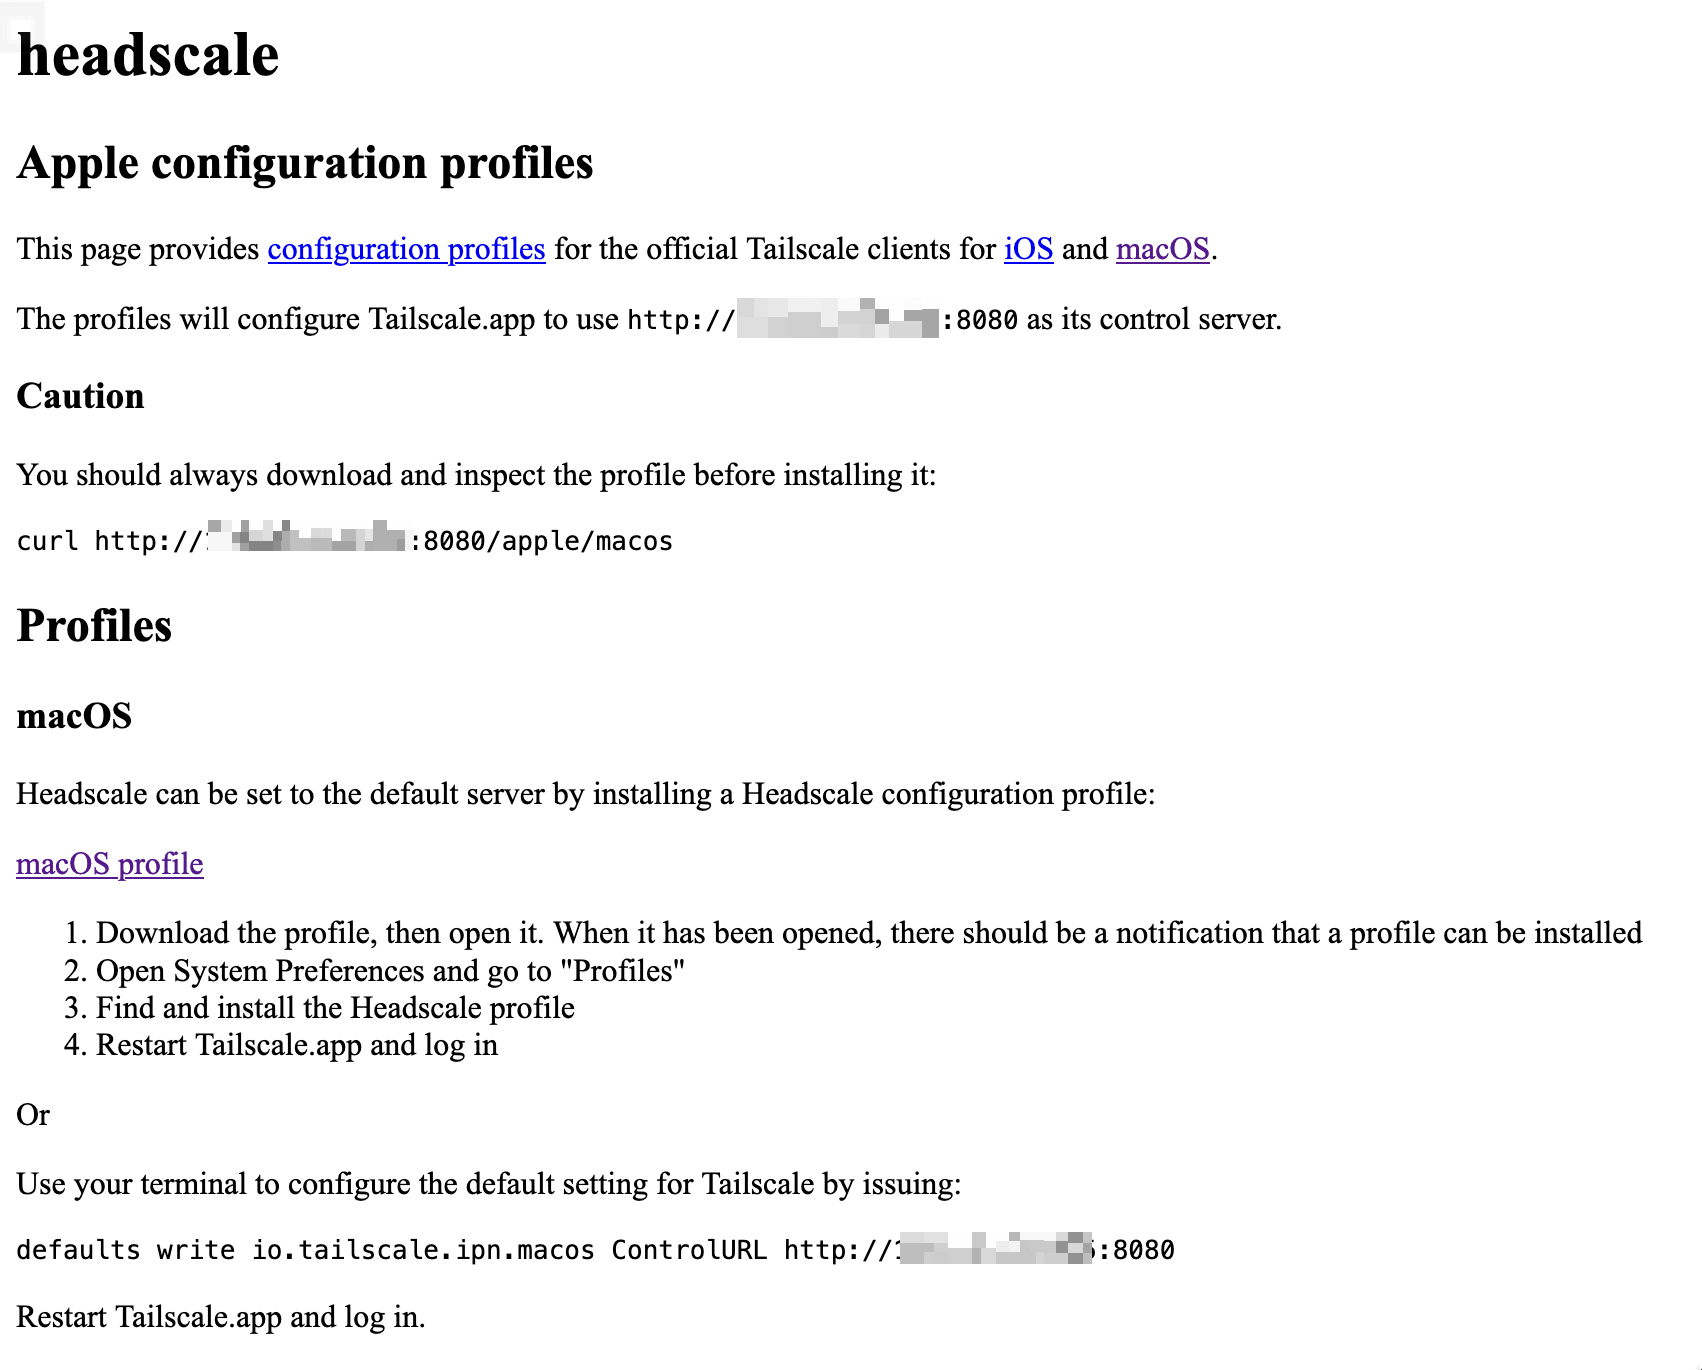
安装完 GUI 版应用后还需要做一些骚操作,才能让 Tailscale 使用 Headscale 作为控制服务器。当然,Headscale 已经给我们提供了详细的操作步骤,你只需要在浏览器中打开 URL:http://<HEADSCALE_PUB_IP>:8080/apple,便会出现如下的界面:
非应用商店版本的 macOS 客户端需要将
io.tailscale.ipn.macos替换为io.tailscale.ipn.macsys。即:defaults write io.tailscale.ipn.macsys ControlURL http://<HEADSCALE_PUB_IP>:8080
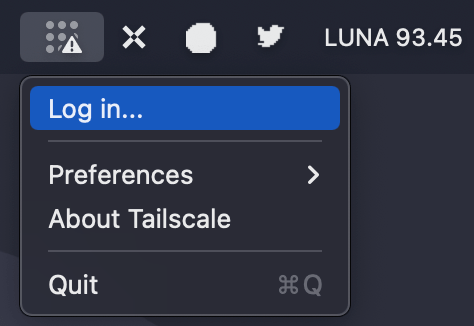
修改完成后重启 Tailscale 客户端,在 macOS 顶部状态栏中找到 Tailscale 并点击,然后再点击 Log in
然后立马就会跳转到浏览器并打开一个页面。

接下来与之前 Linux 客户端相同,回到 Headscale 所在的机器执行浏览器中的命令即可,注册成功
回到 Headscale 所在主机,查看注册的节点:
|
|
回到 macOS,测试是否能 ping 通对端节点:
|
|
也可以使用 Tailscale CLI 来测试:
|
|
Windows
Windows Tailscale 客户端想要使用 Headscale 作为控制服务器,只需在浏览器中打开 URL:http://<HEADSCALE_PUB_IP>:8080/windows,便会出现如下的界面
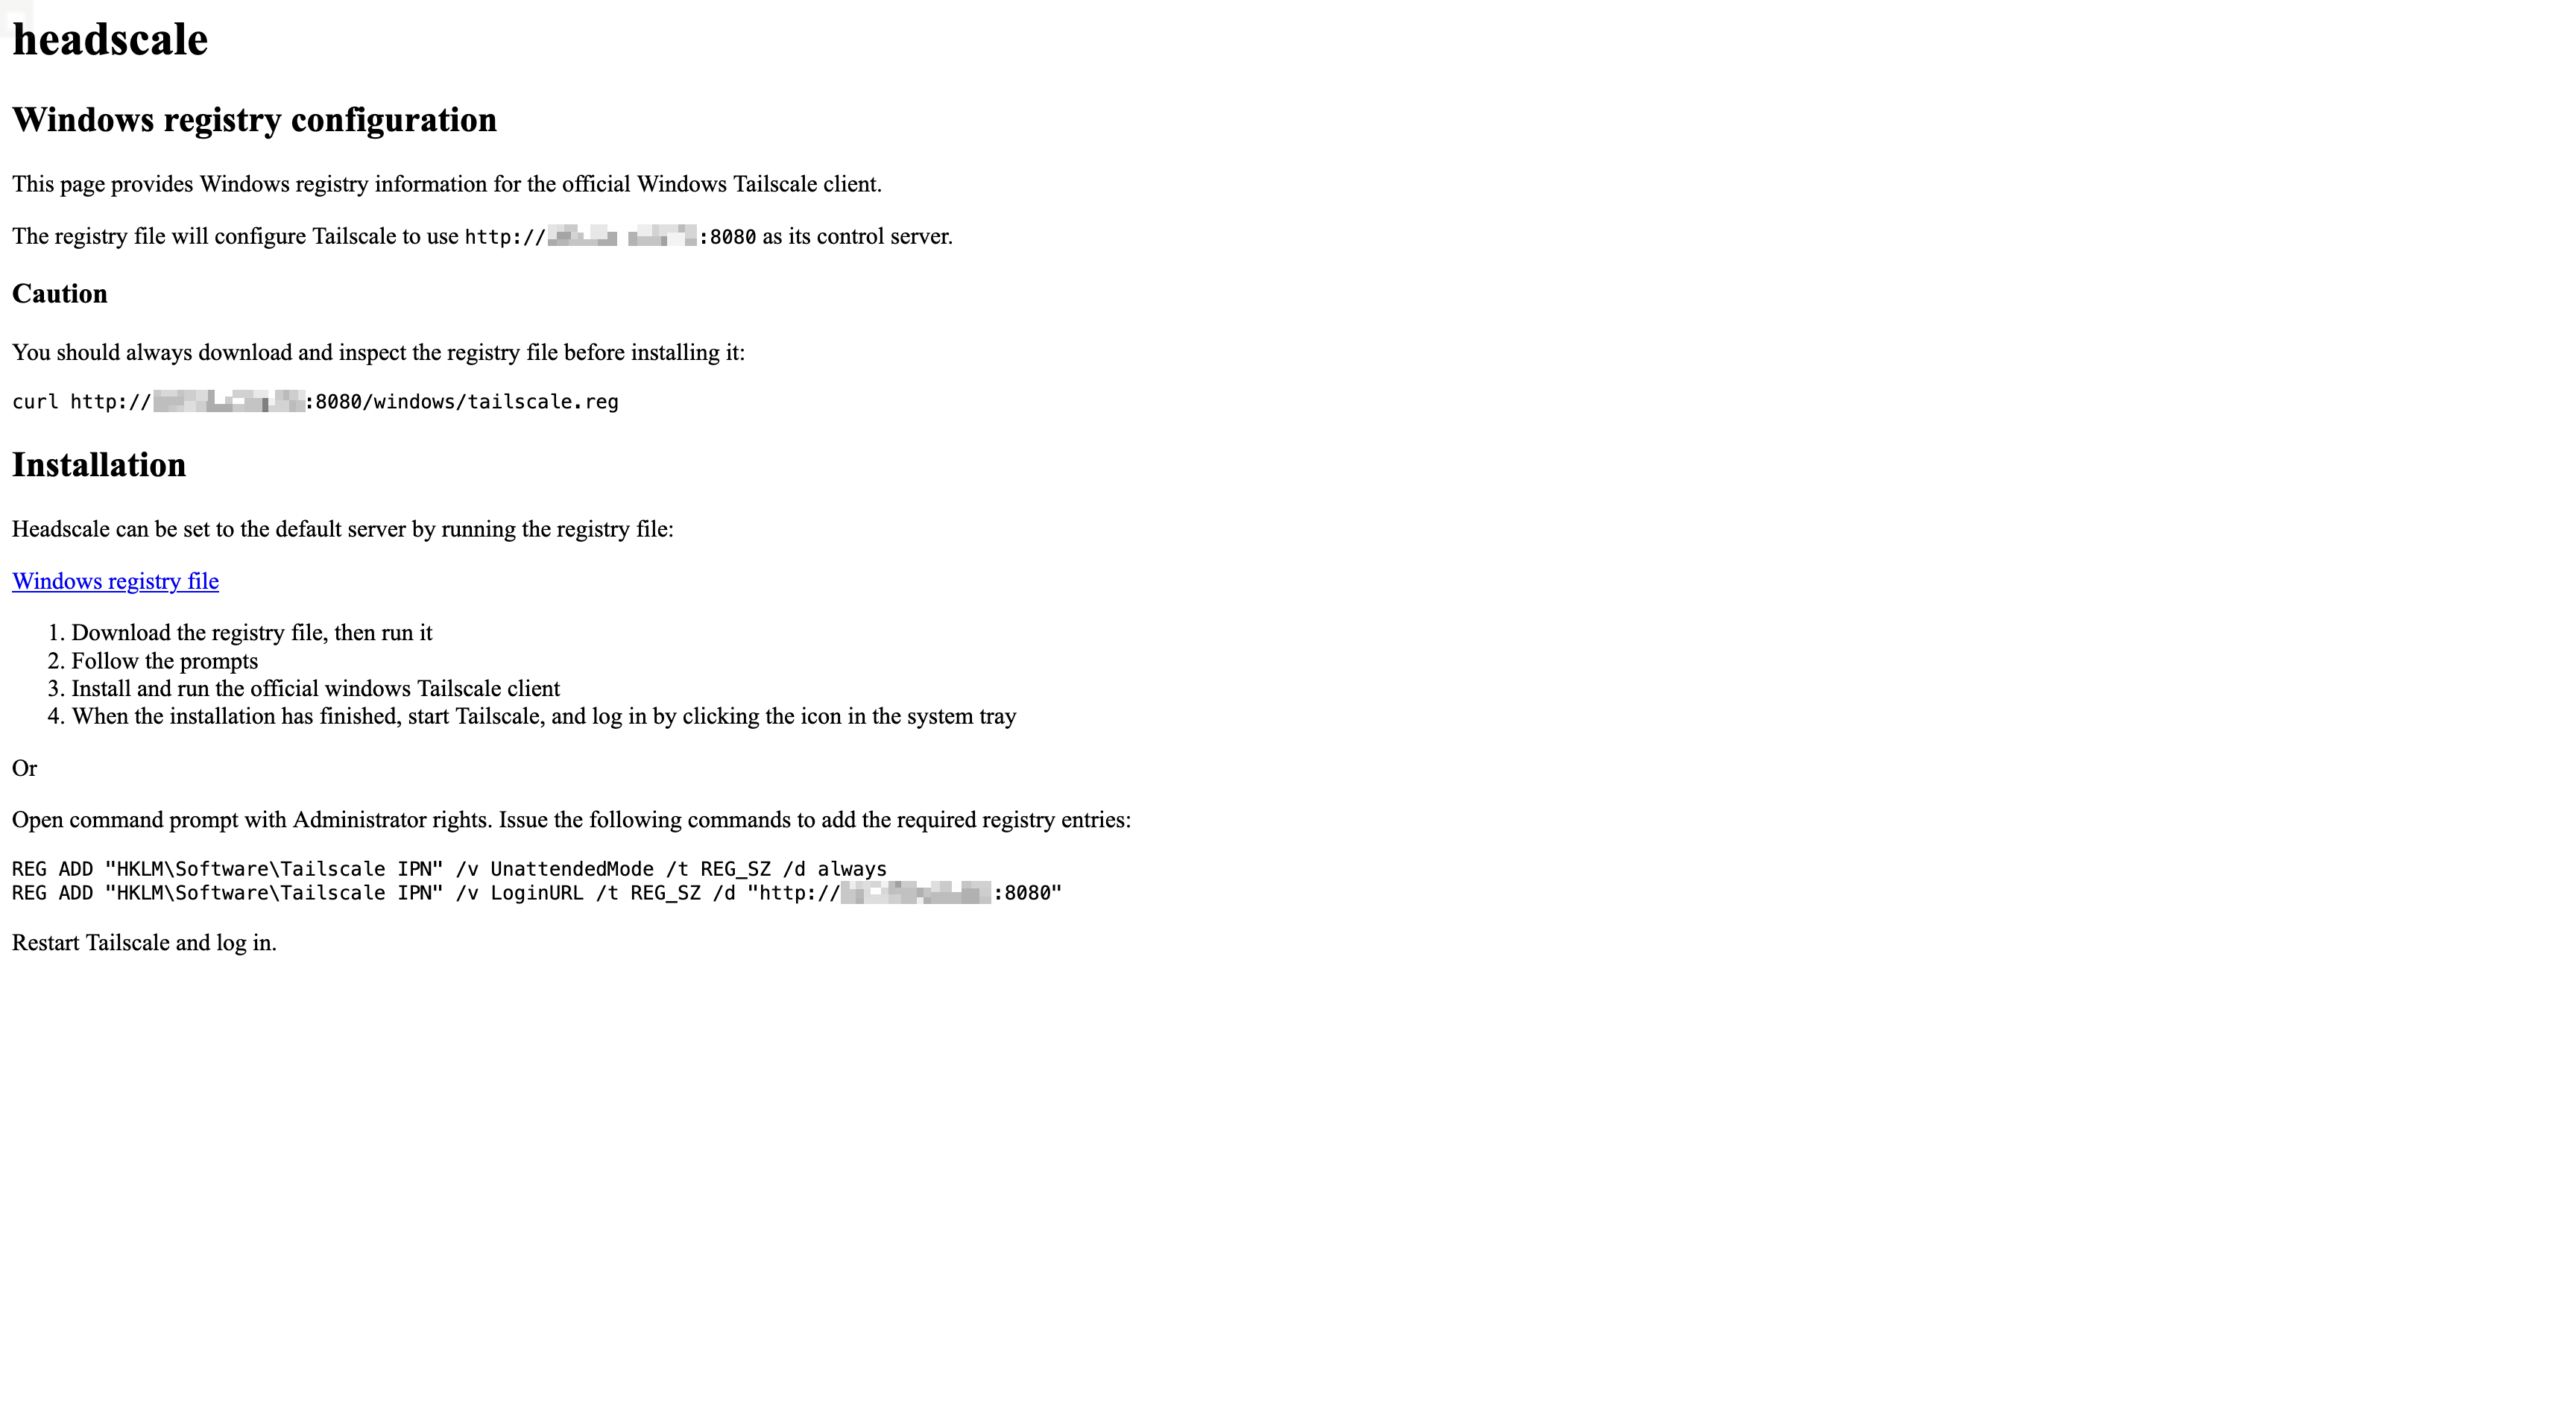
按照其中的步骤操作即可。
通过 Pre-Authkeys 接入
前面的接入方法都需要服务端同意,步骤比较烦琐,其实还有更简单的方法,可以直接接入,不需要服务端同意。
首先在服务端生成 pre-authkey 的 token,有效期可以设置为 24 小时:
|
|
查看已经生成的 key:
|
|
现在新节点就可以无需服务端同意直接接入了:
|
|
打通局域网
到目前为止我们只是打造了一个点对点的 Mesh 网络,各个节点之间都可以通过 WireGuard 的私有网络 IP 进行直连。但我们可以更大胆一点,还记得我在文章开头提到的访问家庭内网的资源吗?我们可以通过适当的配置让每个节点都能访问其他节点的局域网 IP。这个使用场景就比较多了,你可以直接访问家庭内网的 NAS,或者内网的任何一个服务,更高级的玩家可以使用这个方法来访问云上 Kubernetes 集群的 Pod IP 和 Service IP。
假设你的家庭内网有一台 Linux 主机(比如 OpenWrt)安装了 Tailscale 客户端,我们希望其他 Tailscale 客户端可以直接通过家中的局域网 IP(例如 192.168.100.0/24) 访问家庭内网的任何一台设备。
配置方法很简单,首先需要设置 IPv4 与 IPv6 路由转发:
|
|
客户端修改注册节点的命令,在原来命令的基础上加上参数 --advertise-routes=192.168.100.0/24。
|
|
在 Headscale 端查看路由,可以看到相关路由是关闭的。
|
|
开启路由:
|
|
其他节点查看路由结果:
|
|
现在你在任何一个 Tailscale 客户端所在的节点都可以 ping 通家庭内网的机器.